# 日志告警
可用版本 >= 0.4.4
clickhouse <= v22.3.7
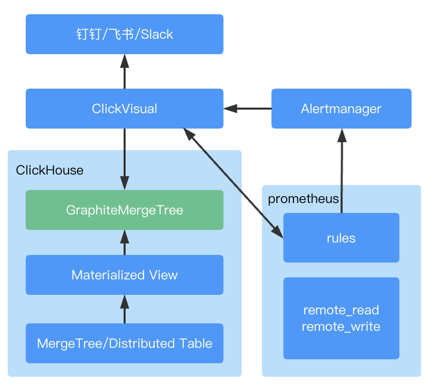
# 架构说明
# 使用说明
- 在 ClickHouse 中产生对应数据表的 Materialized View,作用是将数据按照配置的规则以秒为单位录入 metrics.samples 表中
- 产生的 Prometheus 告警规则写入配置的文件或者 configmap 中
- Prometheus 读取 metrics.samples 的数据,并根据告警规则产生告警,推送到 Prometheus AlertManager
- Prometheus AlertManager 通过 webhook 推送到 clickvisual,再由 clickvisual 分发到钉钉
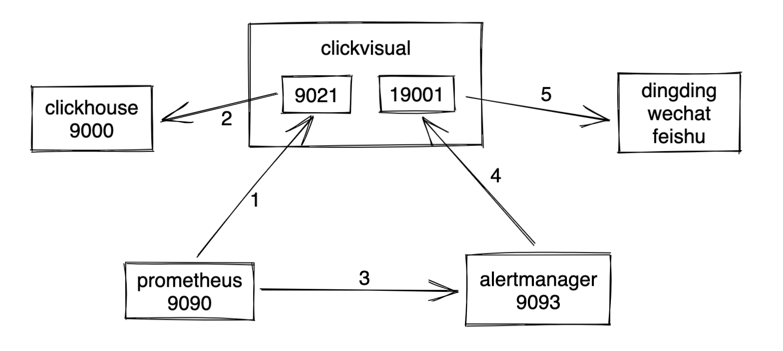
# 组件配置
按照文档完成安装后告警触发流程如下
# ClickVisual
配置文件中增加如下配置,作用是让 Prometheus 远程读写 ClickHouse
- host:port 表示 prometheus 配置的 remote_read/remote_write 需要的 host:port
- 其余配置为 clickhouse 配置
clickhouseDSN 格式参考:
clickhouse://username:password@host:9000/metrics?dial_timeout=200ms&max_execution_time=60
[prom2click]
enable = true

[[prom2click.cfgs]]
host = "127.0.0.1"
port = 9201
clickhouseDSN = "tcp://127.0.0.1:9000"
clickhouseDB = "metrics"
clickhouseTable = "samples"
2
3
4
5
6
7
8
9
# ClickHouse
新增graphite_rollup 配置,配置路径可以参考,根据 clickhouse 的版本不通略有区别,具体以官方指导配置为准。

<yandex>
  <graphite_rollup>
    <path_column_name>tags</path_column_name>
    <time_column_name>ts</time_column_name>
    <value_column_name>val</value_column_name>
    <version_column_name>updated</version_column_name>
    <default>
      <function>sum</function>
      <retention>
        <age>0</age>
        <precision>1</precision>
      </retention>
      <retention>
        <age>360</age>
        <precision>60</precision>
      </retention>
      <retention>
        <age>3600</age>
        <precision>300</precision>
      </retention>
      <retention>
        <age>86400</age>
        <precision>3600</precision>
      </retention>
    </default>
  </graphite_rollup>
</yandex>
2
3
4
5
6
7
8
9
10
11
12
13
14
15
16
17
18
19
20
21
22
23
24
25
26
27
# Prometheus
需要支持配置热更新,参考文档 (opens new window)
从 2.0 开始,hot reload 功能是默认关闭的,如需开启,需要在启动 Prometheus 的时候,添加 --web.enable-lifecycle 参数。
启动文件里面增加如下配置:
- clickvisual 为对应服务访问地址
- alertmanager 为对应服务访问地址
rule_files 中配置的路径需要与系统配置中下发路径一致
global:
  evaluation_interval: "15s"
rule_files:
  - /etc/prometheus/rules/*.yaml
alerting:
  # 告警配置文件
  alertmanagers:
  # 修改:使用静态绑定
  - static_configs:
    # 修改:targets、指定地址与端口
    - targets: ["alertmanager:9093"]
remote_read:
  - url: "http://clickvisual:9201/read"
    read_recent: true
2
3
4
5
6
7
8
9
10
11
12
13
14
# AlertManager
告警方式为 webhook,回调到 clickvisual 服务,修改 url 地址,保证可以正常访问 clickvisual 服务。
route:
  group_by: ['alertname', 'cluster', 'service']
  group_wait: 30s
  group_interval: 5m
  repeat_interval: 10m
  receiver: webhook

receivers:
- name: 'webhook'
  webhook_configs:
  - url: 'http://clickvisual:19001/api/v1/prometheus/alerts'
2
3
4
5
6
7
8
9
10
11
# 进入 ClickVisual 进行后续操作
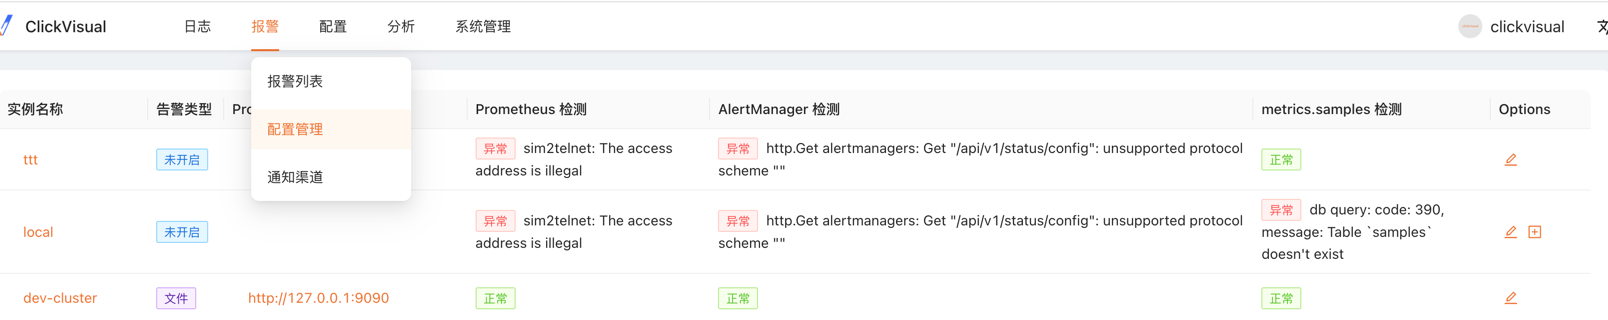
# 基础配置
如果已添加实例,可以看到如下界面,检测上面配置的各组件是否正确。
点击提示没有 mertics.samples 表,点击操作中的 + ,即可完成基础数据表创建。
# 文件模式
将告警规则写入本地文件,则将文件路径配置为 /etc/prometheus/rules
tips:考虑容器挂载统一同一个目录的情况,这里的配置路径为 clickvisual 可读写路径,会通过挂载自动同步到 prometheus。
rule_files:
- /etc/prometheus/rules/*.yaml
2
# K8s 模式
如果是使用 K8s 模式选择对应 configmap 即可。
# Operator 模式
metadata:
  labels:
    prometheus: k8s
    role: alert-rules
  name: prometheus-k8s-rulefiles-0
  namespace: monitoring
2
3
4
5
6
根据以上配置,rules 会存储到如下环境的,一下文件中。

文件名 monitoring-prometheus-k8s-rulefiles-0-056fd48d-b00b-4291-9737-bc53cf343f8a.yaml
内容:
groups:
- name: cv-1-a06b3784-a4d1-4d20-8adf-1d00827f2be7
  rules:
  - alert: ClickVisual-a06b3784_a4d1_4d20_8adf_1d00827f2be7_58
    annotations:
    description: '{{ $labels.desc }}  (当前值: {{ $value }})'
    summary: 告警 {{ $labels.name }}
    expr: min_over_time(clickvisual_alert_metrics{uuid="a06b3784-a4d1-4d20-8adf-1d00827f2be7",alarmId="1",filterId="58"}[1m] offset 10s)>50
    for: 1m
    labels:
    severity: warning
- name: cv-1-a0698d5a-9584-4979-90fc-2ff2a667d7c1
  rules:
  - alert: ClickVisual-a0698d5a_9584_4979_90fc_2ff2a667d7c1_9
    annotations:
    description: '{{ $labels.desc }}  (当前值: {{ $value }})'
    summary: 告警 {{ $labels.name }}
    expr: clickvisual_alert_metrics{uuid="a0698d5a-9584-4979-90fc-2ff2a667d7c1",alarmId="2",filterId="9"} offset 10s>1
    for: 1m
    labels:
    severity: warning
2
3
4
5
6
7
8
9
10
11
12
13
14
15
16
17
18
19
20
21
# 告警配置
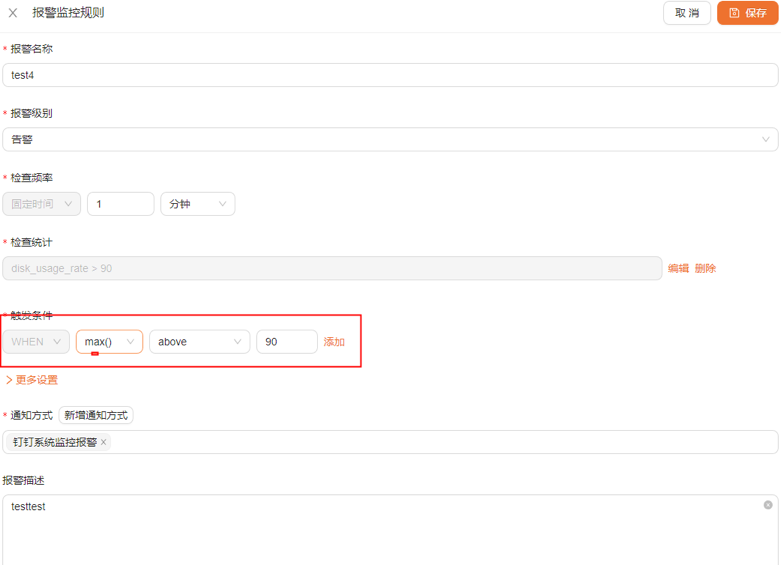
- 检查频率:监控数据数据检测周期
- 检查统计:按照秒进行数据统计
- 常规模式,统计符合规则数据条数
- 聚合模式,记录 val 值
- 触发条件:对检查统计步骤计算的值进行规则检测后触发告警
比如以上例子,日志中每秒出现 disk_usage_rate>90 的日志总条数大于 90。
# 常规模式
在输入框部分填入 where 部分语句即可,点击预览后进入后续告警流程。
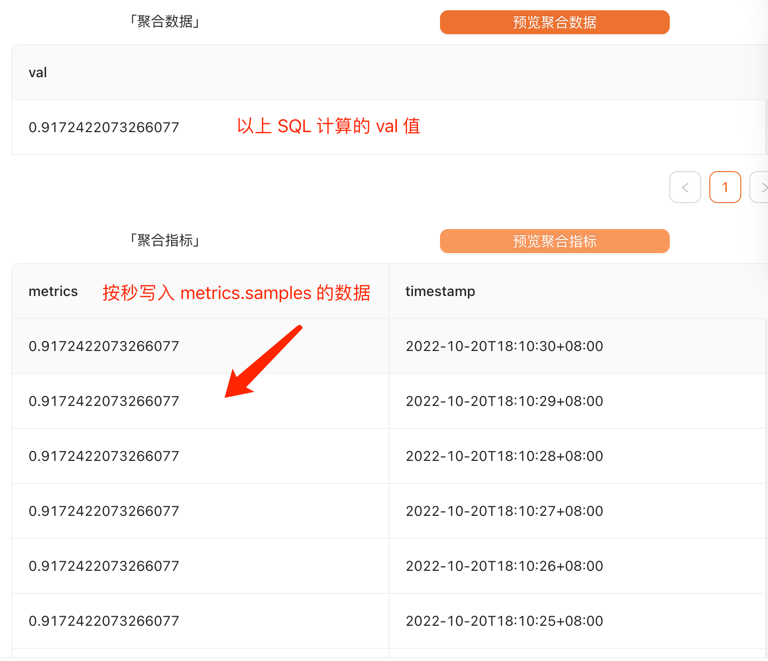
# 聚合模式
例如你需要配置一小时内 nginx 访问失败率的告警,SQL 语句如下所示:
SELECT
       round(sum( case when status > 499 then 1 else 0 end ) * 100.0 / count(1), 2) as val,
       proxy_upstream_name  as service
from ingress.ingress_stdout
WHERE ("_time_second_" >= toDateTime(NOW() - 3600)) AND ("_time_second_" < toDateTime(NOW()))
group by service
having  length(service) > 3
ORDER by val desc
2
3
4
5
6
7
8
根据这个配置计算出来,metrics 是实际写入 metrics.samples 的值,即【触发条件】配置的目标数据
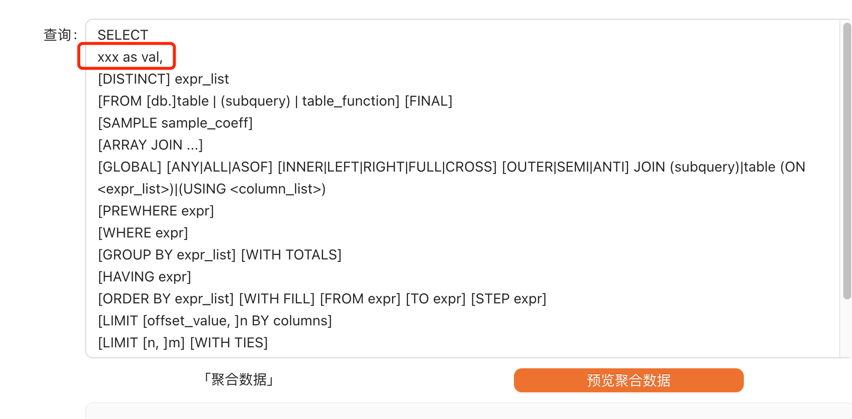
要求:
- select 监控指标必须使用
as val - 其他的语法为 clickhouse 语法 参考文档 (opens new window)
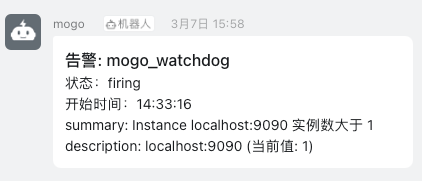
# 推送效果